
10 Bře
2022
10 Bře
'22
22:58
Hello,
I recently deployed knot-resolver as main resolver for my network with
following config:
-- modules
modules = {
'policy',
'view',
'workarounds < iterate',
'stats', -- required by predict module
'predict',
'http',
}
-- network
net.ipv6 = false
net.listen('0.0.0.0', 53, { kind = 'dns' })
net.listen('0.0.0.0', 8453, { kind = 'webmgmt' })
-- permissions
user('knot-resolver','knot-resolver')
-- cache, stats, performance optimizations
cache.open(950*MB, 'lmdb:///cache/knot-resolver')
cache.min_ttl(600)
predict.config({
window = 5,
period = 1*(60/5)
})
-- limit access with ACLs
view:addr('127.0.0.0/8', policy.all(policy.PASS))
view:addr('172.16.0.0/12', policy.all(policy.PASS))
view:addr('10.0.0.0/8', policy.all(policy.PASS))
view:addr('redacted', policy.all(policy.PASS))
view:addr('redacted', policy.all(policy.PASS))
view:addr('redacted', policy.all(policy.PASS))
view:addr('0.0.0.0/0', policy.all(policy.DROP))
-- query resolving policies
policy.add(policy.rpz(policy.ANSWER, '/run/knot-resolver/custom.rpz',
true))
policy.add(policy.all(policy.FORWARD({
"9.9.9.9",
"8.8.8.8",
})))
Process is started inside docker container with properly attached tmpfs at
/cache mountpoint.
Setup is monitored through prometheus and I received notification around
21:55 that exporter is down. To be exact context deadline exceeded
(scrape_interval: 15s).
I grabbed control socket and dumped following stats:
worker.stats()
{
['concurrent'] = 1,
['csw'] = 31436648,
['dropped'] = 16081,
['err_http'] = 0,
['err_tcp'] = 0,
['err_tls'] = 0,
['err_udp'] = 0,
['ipv4'] = 9950850,
['ipv6'] = 0,
['pagefaults'] = 1,
['queries'] = 30978879,
['rss'] = 166846464,
['swaps'] = 0,
['systime'] = 2681.109337,
['tcp'] = 232596,
['timeout'] = 139212,
['tls'] = 0,
['udp'] = 9718254,
['usertime'] = 6298.521581,
}
cache.stats()
{
['clear'] = 1,
['close'] = 1,
['commit'] = 23279836,
['count'] = 20349,
['count_entries'] = 340222,
['match'] = 0,
['match_miss'] = 0,
['open'] = 2,
['read'] = 144512076,
['read_leq'] = 10170653,
['read_leq_miss'] = 4988410,
['read_miss'] = 25166216,
['remove'] = 0,
['remove_miss'] = 0,
['usage_percent'] = 11.396792763158,
['write'] = 25742556,
}
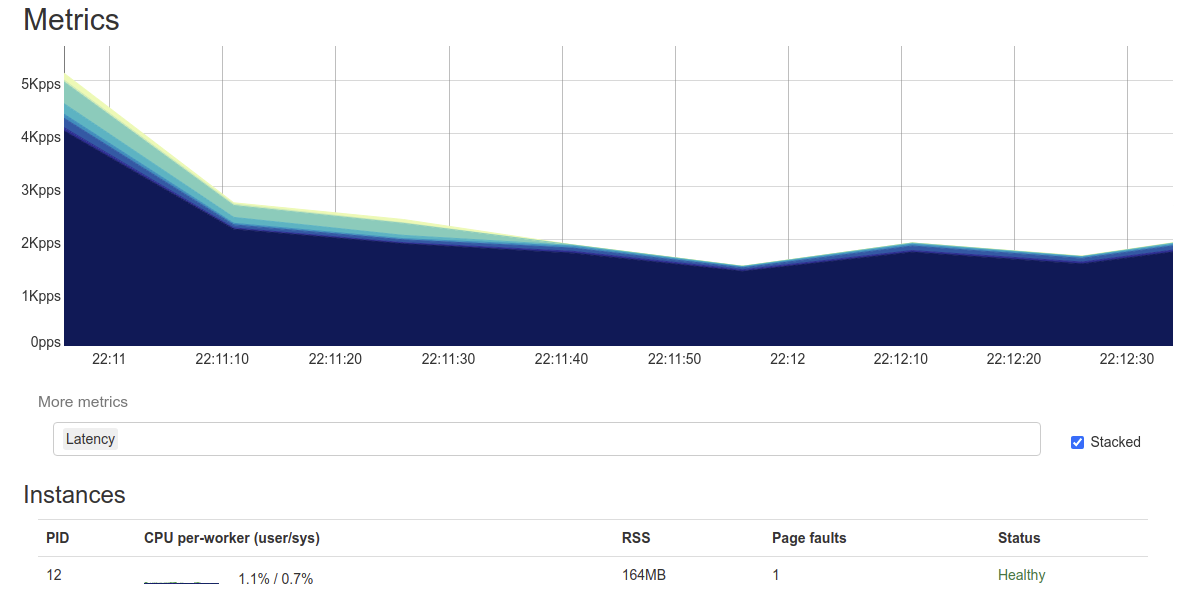
When I opened web interface I noticed steady decline in requests.
[image: image.png]
I think this means that clients mostly moved to secondary DNS resolver.
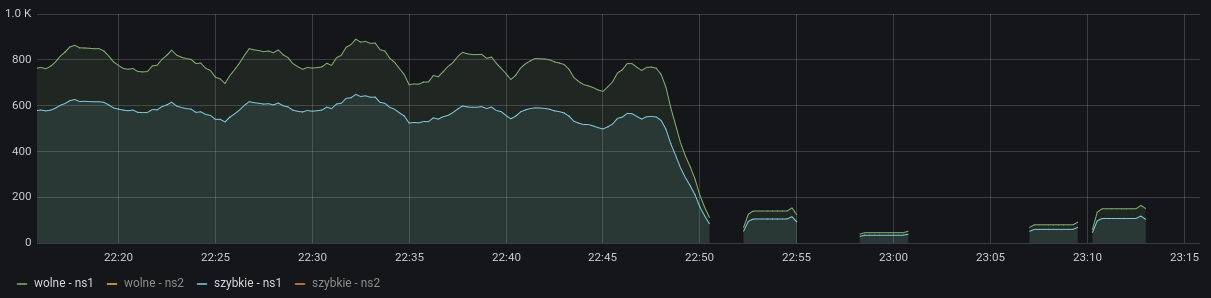
Also when reviewing gathered data in grafana dashboard I noticed that slow
(250ms+) queries are prevalent from the fast queries.
[image: image.png]
Any advice what happened here?
Best regards,
Łukasz Jarosz
1487
days inactive
1487
days old
knot-resolver-users@lists.nic.cz
0 comments
1 participants
participants (1)
-
 Łukasz Jarosz